Welcome to
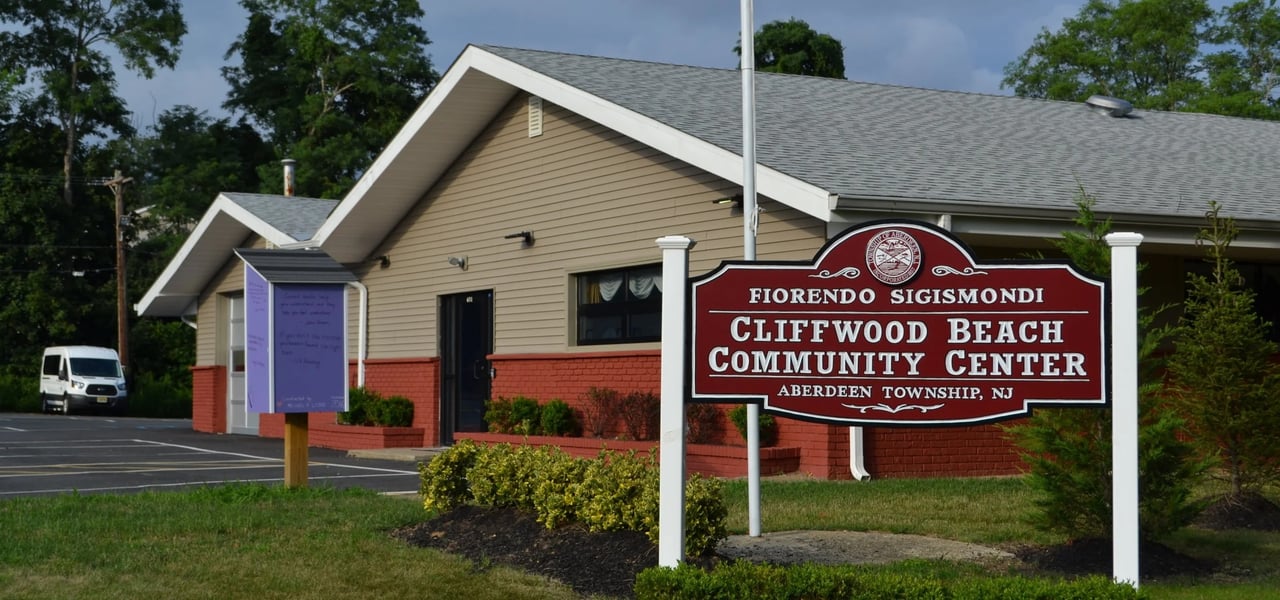
Cliffwood Community Center
The center plays a crucial role in fostering community spirit and providing valuable resources to the local population.
The Cliffwood Community Center is the heart of local activity, offering a wide range of programs and events for residents of all ages. From fitness classes to social gatherings and educational workshops, the center plays a crucial role in fostering community spirit and providing valuable resources to the local population.
19,203 people live in Cliffwood Community Center, where the median age is 43.6 and the average individual income is $47,998. Data provided by the U.S. Census Bureau.
Total Population
Median Age
Population Density
Average individual Income
There's plenty to do around Cliffwood Community Center, including shopping, dining, nightlife, parks, and more. Data provided by Walk Score and Yelp.
Explore popular things to do in the area, including Keyport Liquor, Down 2 Earth Wellness, and Romeo's Pizza.
| Name | Category | Distance | Reviews |
Ratings by
Yelp
|
|---|---|---|---|---|
| Dining | 0.27 miles | 2 reviews | 4.5/5 stars | |
| Dining | 0.27 miles | 5 reviews | 5/5 stars | |
| Dining | 1 miles | 0 reviews | 0/5 stars | |
| Dining | 1.06 miles | 1 review | 3/5 stars | |
| Dining | 1.09 miles | 0 reviews | 0/5 stars | |
| Active | 0.13 miles | 2 reviews | 4/5 stars | |
| Active | 0.56 miles | 3 reviews | 4.7/5 stars | |
| Active | 0.7 miles | 0 reviews | 0/5 stars | |
| Active | 0.93 miles | 1 review | 5/5 stars | |
| Beauty | 0.24 miles | 1 review | 1/5 stars | |
| Beauty | 0.24 miles | 2 reviews | 5/5 stars | |
| Beauty | 0.26 miles | 0 reviews | 0/5 stars | |
| Beauty | 0.28 miles | 0 reviews | 0/5 stars | |
| Beauty | 0.28 miles | 0 reviews | 0/5 stars | |
| Beauty | 0.29 miles | 0 reviews | 0/5 stars | |
| Beauty | 0.34 miles | 4 reviews | 4/5 stars | |
| Beauty | 1 miles | 4 reviews | 2/5 stars | |
| Beauty | 1 miles | 0 reviews | 0/5 stars | |
|
|
||||
|
|
||||
|
|
||||
|
|
||||
|
|
||||
|
|
Cliffwood Community Center has 7,938 households, with an average household size of 2.41. Data provided by the U.S. Census Bureau. Here’s what the people living in Cliffwood Community Center do for work — and how long it takes them to get there. Data provided by the U.S. Census Bureau. 19,203 people call Cliffwood Community Center home. The population density is 3,955 and the largest age group is Data provided by the U.S. Census Bureau.
Total Population
Population Density Population Density This is the number of people per square mile in a neighborhood.
Median Age
Men vs Women
Population by Age Group
0-9 Years
10-17 Years
18-24 Years
25-64 Years
65-74 Years
75+ Years
Education Level
Total Households
Average Household Size
Average individual Income
Households with Children
With Children:
Without Children:
Blue vs White Collar Workers
Blue Collar:
White Collar:
Explore Other Neighborhoods

117 Main St Woodbridge Township, NJ 07095
117 Main St Woodbridge Township, NJ 07095